A company’s revenue grew—but why did cash flow fail to grow with it? Management said demand was strong—but did the following year’s results support that claim? Earnings were already released—so why has the data panel not updated?
These questions appear different, but they point to the same problem: investment research is not simply about collecting more information. The harder task is making information from different periods, sources, and accounting definitions explain one another.
AceStocks is an experiment in building that kind of research workspace. It brings consensus estimates, earnings events, operating trends, and leadership influence into one reading flow—without rushing to compress a complicated company into a single buy-or-sell score.
Reader note: This article presents a product prototype in development. Screenshots include historical snapshots and clearly labeled static examples. They do not represent real-time market data, an audit opinion, or investment advice. Public companies shown in the interface are illustrative and do not reveal anyone’s portfolio.
01 / Read five annual reports as one story
Viewed in isolation, revenue, profit, and cash flow are outcomes. Placed on the same five-year timeline, they lead to better questions: Did reported profit turn into cash? Did growth require an increasingly large investment in working capital? Did this year’s spending produce a corresponding result later?
The “Five-year operating continuity” card places revenue, net income, and operating cash flow side by side, then adds clues such as accounts receivable and capital expenditure. The chart helps readers notice change; the annual values let them inspect it.
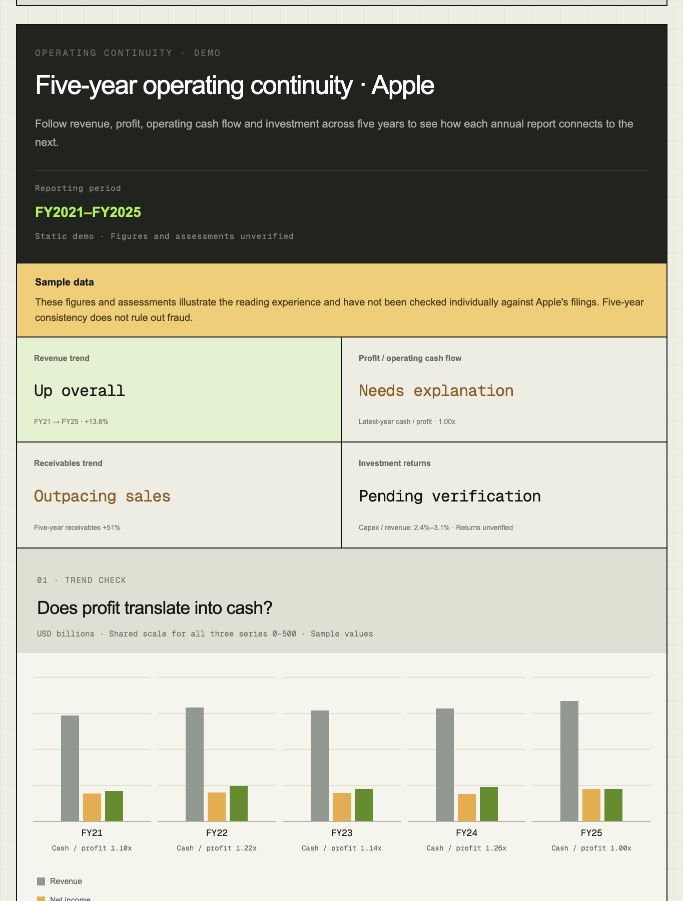
The goal is not to “prove that a company did not commit fraud” with five years of data. Multi-year reports can still contain misstatements, and apparently consistent metrics do not eliminate risk. The module’s purpose is to turn a vague concern into a set of questions that can be investigated.
02 / Every conclusion should carry an explanation and a next check
Many dashboards tell a user whether something is “good” or “bad” without explaining why. AceStocks takes another approach: describe the observed relationship, explain why it deserves attention, and identify what should be checked next.
If receivables grow faster than revenue, for example, the interface does not immediately label the company problematic. It suggests checking collection periods, business mix, and the relevant disclosures. A divergence between profit and cash flow likewise needs to be decomposed into working capital, taxes, and one-off items before it can support a conclusion.
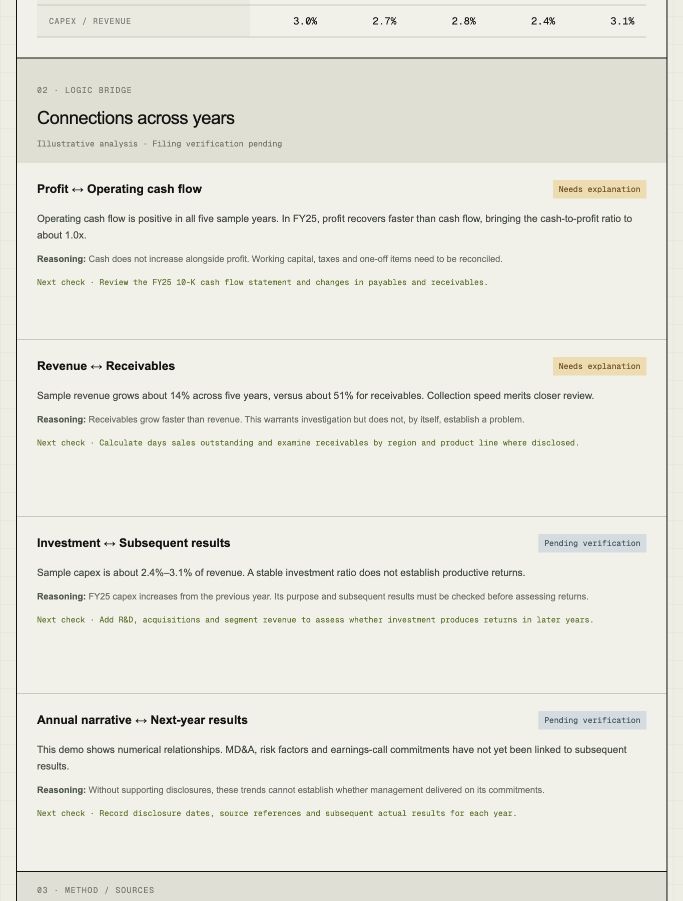
This design gives uncertainty a legitimate place in the workflow. When evidence is missing, showing “pending verification” is more useful than filling the gap with a confident-looking answer.
03 / The earnings radar: from chasing news to managing the order of verification
The five-year view looks for continuity; the earnings radar looks for new change. It lives on a separate page, organizes companies by sector and industry, and treats pre-release expectations, reported results, and follow-up evidence as distinct stages.
The process begins by freezing the consensus snapshot available before the disclosure. It then compares actual results with that snapshot and waits for guidance, estimate revisions, and earnings-call evidence. This avoids using estimates that changed after the release to explain how surprising the release was at the time.
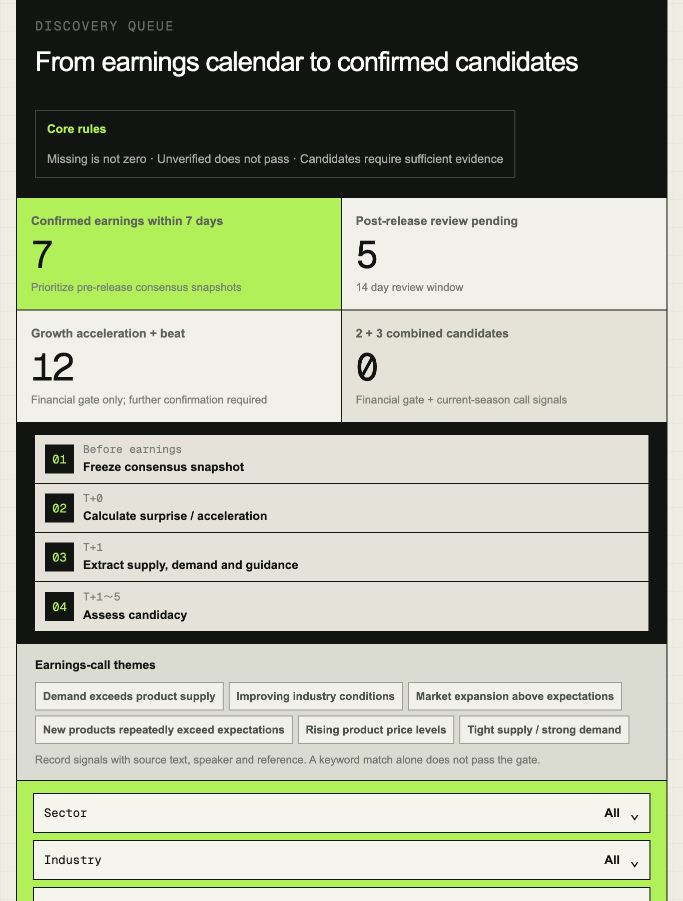
The radar also preserves an important distinction: a company may have disclosed results before a market-data provider updates its dataset. The project uses SEC submission metadata to identify disclosure signals, then combines them with structured FMP data. Forms 8-K, 10-Q, 10-K, 6-K, and 20-F are relevant filing types, but not every filing constitutes the quarter’s earnings release. The filing item, reporting period, and nature of the content still need to be checked.
The same separation applies to earnings calls. A transcript being available, translated, and analyzed are three different states. The current prototype still contains collection queues, accumulating baselines, and unverified steps; a keyword match alone does not pass the evidence gate.
04 / Keep numbers, people, and sources distinct
Operating results come from an organization, and leadership decisions can influence them. The leadership-impact card places decision influence, board oversight, and key-person risk side by side. It helps readers distinguish who can make a decision, who can constrain it, and what might change if a central leader leaves.
These dimensions are analytical constructs, not ready-made fields from a financial statement. Company disclosures can establish roles, governance arrangements, and documented actions. Assessing the magnitude of influence or risk requires interpretation; the company’s entire growth or decline cannot simply be attributed to one person.
SEC filing metadata, FMP standardized fields, locally derived metrics, and analyst interpretation should likewise not be presented as one undifferentiated category called “data.” Source links, field definitions, and verification labels preserve these boundaries. The bilingual interface also lets readers move more naturally between explanatory prose and the original financial terminology.
The intended outcome is a better question
AceStocks is not designed to make the final investment decision for its reader. It aims to reduce a different cost: moving among many websites while still not knowing what you believe, what evidence is missing, or what should be verified next.
When a research session leaves behind a clear observation, a traceable source, an unresolved difference, and a useful next check, financial reports stop being a pile of numbers. They become a chain of operating logic that can be questioned over time.
About this article: It was prepared from the current project interface and implementation. The financial and governance claims in the sample company panels were not independently researched for this article. All images are genuine interface screenshots, cropped only for layout and privacy; their data has not been redrawn or modified. User identifiers, account details, personal holdings, and local file paths have been excluded.